Graphical Analysis GW (Go Wire
50 હજાર+
ડાઉનલોડ

PEGI 3
info


આ ઍપનું વર્ણન
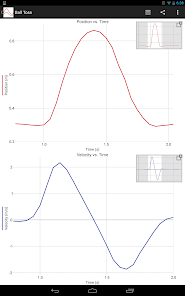
Graphical Analysis™ GW is a tool for science students to collect, graph, and analyze data from Vernier Go Wireless® sensors.
Sensor data-collection support:
• Vernier Go Wireless® Temp and Go Wireless pH sensors
• Vernier Go Wireless Heart Rate and Go Wireless Exercise Heart Rate monitors
• Vernier LabQuest® sensors used with Go Wireless Link or LabQuest Stream interfaces
Additional experiment options:
• Data Sharing via Wi-Fi connection to LabQuest 2 or Logger Pro® 3
• Built-in Sensors (accelerometers)
• Manual Entry
Note: Sensor data collection and Data Sharing require the purchase of hardware from Vernier Software & Technology. Built-in sensor and manual entry of data can be performed without a hardware purchase. For more information on Data Sharing, visit http://www.vernier.com/css
Key Features - Data Collection
• Multi-sensor data-collection support (requires LabQuest Stream)
• Time Based, Event Based data-collection modes
• Configurable data-collection rate and duration for time-based data collection
• Option to zero sensor readings
• Manual entry of data from keyboard and clipboard
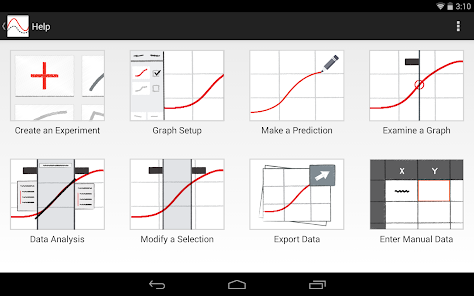
Key Features - Data Analysis
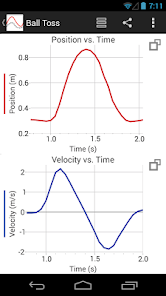
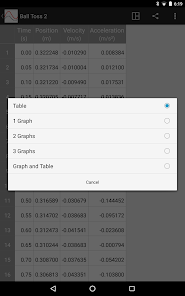
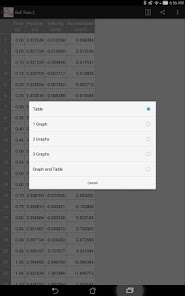
• Display one, two, or three graphs simultaneously
• View data in a table or show a graph and table side-by-side
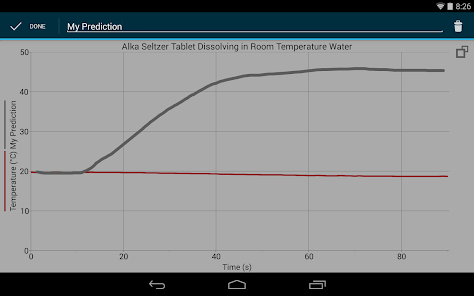
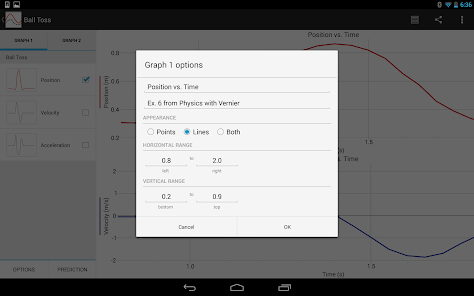
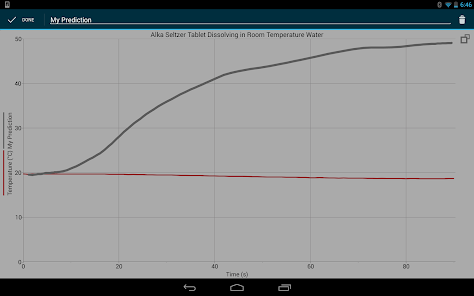
• Draw Predictions on a graph to uncover misconceptions
• Examine and select data
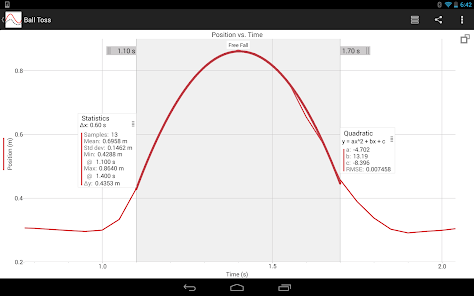
• Apply Statistics calculations to find mean, min, max, and standard deviation
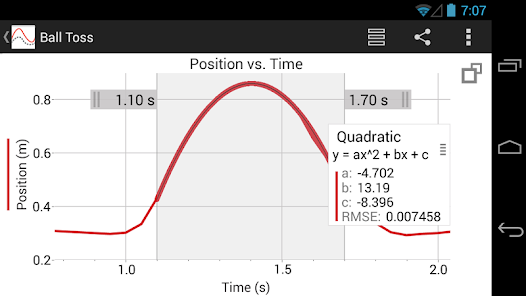
• Perform curve fits, including linear, quadratic, natural exponent, and more
• Pinch to scale graphs
Key Features - Collaboration and Sharing
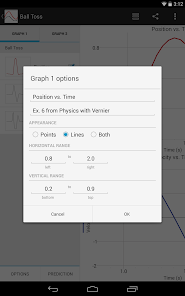
• Create text annotations and add graph titles
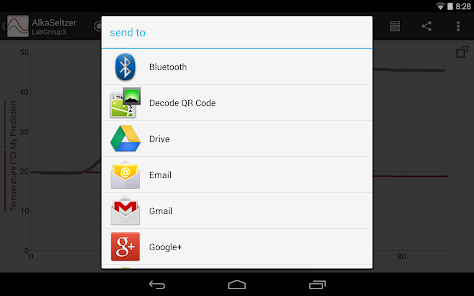
• Export graphs and data for printing and inclusion in lab reports
• Export data in .CSV format for analysis of data in spreadsheet software such as Excel®, Google Sheets™, and Numbers®
Note: The above features apply to version 3.2 only, available for devices running Android OS version 4.3 or newer. Android devices running OS versions 4.1-4.22 will receive Graphical Analysis version 1.2, which only supports Data Sharing, Built-in Sensors, and Manual Entry experiments.
Vernier Software & Technology has over 35 years of experience in providing effective learning resources for understanding experimental data in science and math classrooms. Graphical Analysis GW is a part of the extensive system of sensors, interfaces, and data-collection software from Vernier for science and STEM education.
Sensor data-collection support:
• Vernier Go Wireless® Temp and Go Wireless pH sensors
• Vernier Go Wireless Heart Rate and Go Wireless Exercise Heart Rate monitors
• Vernier LabQuest® sensors used with Go Wireless Link or LabQuest Stream interfaces
Additional experiment options:
• Data Sharing via Wi-Fi connection to LabQuest 2 or Logger Pro® 3
• Built-in Sensors (accelerometers)
• Manual Entry
Note: Sensor data collection and Data Sharing require the purchase of hardware from Vernier Software & Technology. Built-in sensor and manual entry of data can be performed without a hardware purchase. For more information on Data Sharing, visit http://www.vernier.com/css
Key Features - Data Collection
• Multi-sensor data-collection support (requires LabQuest Stream)
• Time Based, Event Based data-collection modes
• Configurable data-collection rate and duration for time-based data collection
• Option to zero sensor readings
• Manual entry of data from keyboard and clipboard
Key Features - Data Analysis
• Display one, two, or three graphs simultaneously
• View data in a table or show a graph and table side-by-side
• Draw Predictions on a graph to uncover misconceptions
• Examine and select data
• Apply Statistics calculations to find mean, min, max, and standard deviation
• Perform curve fits, including linear, quadratic, natural exponent, and more
• Pinch to scale graphs
Key Features - Collaboration and Sharing
• Create text annotations and add graph titles
• Export graphs and data for printing and inclusion in lab reports
• Export data in .CSV format for analysis of data in spreadsheet software such as Excel®, Google Sheets™, and Numbers®
Note: The above features apply to version 3.2 only, available for devices running Android OS version 4.3 or newer. Android devices running OS versions 4.1-4.22 will receive Graphical Analysis version 1.2, which only supports Data Sharing, Built-in Sensors, and Manual Entry experiments.
Vernier Software & Technology has over 35 years of experience in providing effective learning resources for understanding experimental data in science and math classrooms. Graphical Analysis GW is a part of the extensive system of sensors, interfaces, and data-collection software from Vernier for science and STEM education.
આ રોજ અપડેટ કર્યું
ડેવલપર તમારો ડેટા કેવી રીતે એકત્રિત અને શેર કરે છે, તે સમજવાથી સુરક્ષાની શરૂઆત થાય છે. તમારા દ્વારા ઍપનો ઉપયોગ, ઉપયોગ થાય તે પ્રદેશ અને તમારી ઉંમરના આધારે ડેટાની પ્રાઇવસી અને સુરક્ષા પદ્ધતિઓ અલગ-અલગ હોઈ શકે છે. ડેવલપર દ્વારા આ માહિતી પ્રદાન કરવામાં આવી છે અને તેઓ સમયાંતરે તેને અપડેટ કરી શકે છે.


નવું શું છે
updated translations
ઍપ સપોર્ટ
phone
ફોન નંબર
+18888376437
ડેવલપર વિશે
VERNIER SOFTWARE & TECHNOLOGY LLC
13979 SW Millikan Way
Beaverton, OR 97005
United States
+1 503-730-8704


