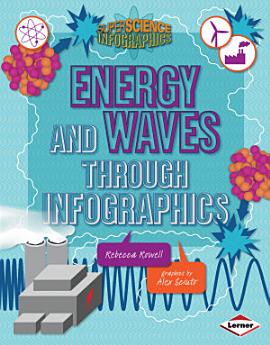
Energy and Waves through Infographics
jaan 2018 · Lerner Publications ™
E-raamat
32
lehekülge
family_home
Sobilik
info
reportHinnangud ja arvustused pole kinnitatud. Lisateave
Teave selle e-raamatu kohta
The supercharged facts about energy and waves can set your brain buzzing! You learn about huge rates of consumption (like the 35.3 quadrillion BTUs of petroleum used in the United States in 2011), huge timelines (it took 300 million years for our greatest source of energy, fossil fuels, to be created), and even huger mysteries (how long it will be before fossil fuels run out).
How can all these big numbers and concepts make more sense? Infographics! The charts, maps, and illustrations in this book tell a visual story to help you better understand key concepts about energy and waves. Crack open this book to explore mind-boggling questions such as:
• What is “the grid” and how does it work?
• How does sound travel?
• How can dancing create energy?
The answers are sure to be shocking!
Hinnake seda e-raamatut
Andke meile teada, mida te arvate.
Lugemisteave
Nutitelefonid ja tahvelarvutid
Installige rakendus Google Play raamatud Androidile ja iPadile/iPhone'ile. See sünkroonitakse automaatselt teie kontoga ja see võimaldab teil asukohast olenemata lugeda nii võrgus kui ka võrguühenduseta.
Sülearvutid ja arvutid
Google Playst ostetud audioraamatuid saab kuulata arvuti veebibrauseris.
E-lugerid ja muud seadmed
E-tindi seadmetes (nt Kobo e-lugerid) lugemiseks peate faili alla laadima ja selle oma seadmesse üle kandma. Failide toetatud e-lugeritesse teisaldamiseks järgige üksikasjalikke abikeskuse juhiseid.


