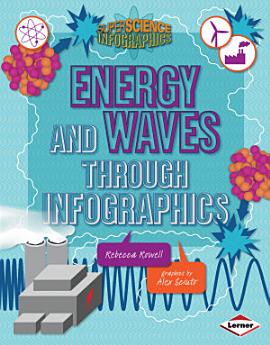
Energy and Waves through Infographics
2018年1月 · Lerner Publications ™
電子書籍
32
ページ
family_home
利用可能
info
report評価とレビューは確認済みではありません 詳細
この電子書籍について
The supercharged facts about energy and waves can set your brain buzzing! You learn about huge rates of consumption (like the 35.3 quadrillion BTUs of petroleum used in the United States in 2011), huge timelines (it took 300 million years for our greatest source of energy, fossil fuels, to be created), and even huger mysteries (how long it will be before fossil fuels run out).
How can all these big numbers and concepts make more sense? Infographics! The charts, maps, and illustrations in this book tell a visual story to help you better understand key concepts about energy and waves. Crack open this book to explore mind-boggling questions such as:
• What is “the grid” and how does it work?
• How does sound travel?
• How can dancing create energy?
The answers are sure to be shocking!
この電子書籍を評価する
ご感想をお聞かせください。
読書情報
スマートフォンとタブレット
Android や iPad / iPhone 用の Google Play ブックス アプリをインストールしてください。このアプリがアカウントと自動的に同期するため、どこでもオンラインやオフラインで読むことができます。
ノートパソコンとデスクトップ パソコン
Google Play で購入したオーディブックは、パソコンのウェブブラウザで再生できます。
電子書籍リーダーなどのデバイス
Kobo 電子書籍リーダーなどの E Ink デバイスで読むには、ファイルをダウンロードしてデバイスに転送する必要があります。サポートされている電子書籍リーダーにファイルを転送する方法について詳しくは、ヘルプセンターをご覧ください。


