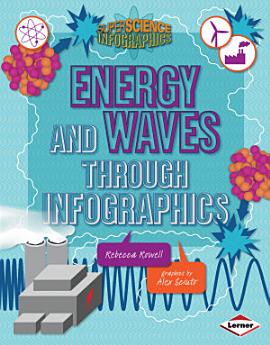
Energy and Waves through Infographics
2018년 1월 · Lerner Publications ™
eBook
32
페이지
family_home
적용 가능
info
report검증되지 않은 평점과 리뷰입니다. 자세히 알아보기
eBook 정보
The supercharged facts about energy and waves can set your brain buzzing! You learn about huge rates of consumption (like the 35.3 quadrillion BTUs of petroleum used in the United States in 2011), huge timelines (it took 300 million years for our greatest source of energy, fossil fuels, to be created), and even huger mysteries (how long it will be before fossil fuels run out).
How can all these big numbers and concepts make more sense? Infographics! The charts, maps, and illustrations in this book tell a visual story to help you better understand key concepts about energy and waves. Crack open this book to explore mind-boggling questions such as:
• What is “the grid” and how does it work?
• How does sound travel?
• How can dancing create energy?
The answers are sure to be shocking!
이 eBook 평가
의견을 알려주세요.
읽기 정보
스마트폰 및 태블릿
노트북 및 컴퓨터
컴퓨터의 웹브라우저를 사용하여 Google Play에서 구매한 오디오북을 들을 수 있습니다.
eReader 및 기타 기기
Kobo eReader 등의 eBook 리더기에서 읽으려면 파일을 다운로드하여 기기로 전송해야 합니다. 지원되는 eBook 리더기로 파일을 전송하려면 고객센터에서 자세한 안내를 따르세요.