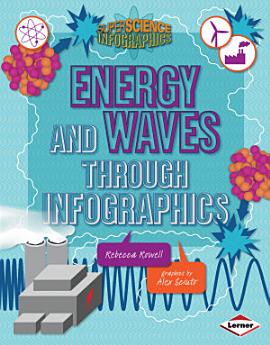
Energy and Waves through Infographics
Jan 2018 · Lerner Publications ™
Kitabu pepe
32
Kurasa
family_home
Kimetimiza masharti
info
reportUkadiriaji na maoni hayajahakikishwa Pata Maelezo Zaidi
Kuhusu kitabu pepe hiki
The supercharged facts about energy and waves can set your brain buzzing! You learn about huge rates of consumption (like the 35.3 quadrillion BTUs of petroleum used in the United States in 2011), huge timelines (it took 300 million years for our greatest source of energy, fossil fuels, to be created), and even huger mysteries (how long it will be before fossil fuels run out).
How can all these big numbers and concepts make more sense? Infographics! The charts, maps, and illustrations in this book tell a visual story to help you better understand key concepts about energy and waves. Crack open this book to explore mind-boggling questions such as:
• What is “the grid” and how does it work?
• How does sound travel?
• How can dancing create energy?
The answers are sure to be shocking!
Kadiria kitabu pepe hiki
Tupe maoni yako.
Kusoma maelezo
Simu mahiri na kompyuta vibao
Sakinisha programu ya Vitabu vya Google Play kwa ajili ya Android na iPad au iPhone. Itasawazishwa kiotomatiki kwenye akaunti yako na kukuruhusu usome vitabu mtandaoni au nje ya mtandao popote ulipo.
Kompyuta za kupakata na kompyuta
Unaweza kusikiliza vitabu vilivyonunuliwa kwenye Google Play wakati unatumia kivinjari cha kompyuta yako.
Visomaji pepe na vifaa vingine
Ili usome kwenye vifaa vya wino pepe kama vile visomaji vya vitabu pepe vya Kobo, utahitaji kupakua faili kisha ulihamishie kwenye kifaa chako. Fuatilia maagizo ya kina ya Kituo cha Usaidizi ili uhamishe faili kwenye visomaji vya vitabu pepe vinavyotumika.


