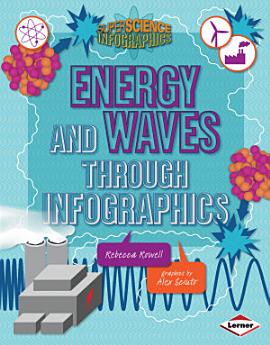
Energy and Waves through Infographics
2018年1月 · Lerner Publications ™
電子書
32
頁數
family_home
符合資格
info
report評分和評論未經驗證 瞭解詳情
關於這本電子書
The supercharged facts about energy and waves can set your brain buzzing! You learn about huge rates of consumption (like the 35.3 quadrillion BTUs of petroleum used in the United States in 2011), huge timelines (it took 300 million years for our greatest source of energy, fossil fuels, to be created), and even huger mysteries (how long it will be before fossil fuels run out).
How can all these big numbers and concepts make more sense? Infographics! The charts, maps, and illustrations in this book tell a visual story to help you better understand key concepts about energy and waves. Crack open this book to explore mind-boggling questions such as:
• What is “the grid” and how does it work?
• How does sound travel?
• How can dancing create energy?
The answers are sure to be shocking!
為這本電子書評分
請分享你的寶貴意見。
閱讀資訊
智能手機和平板電腦
手提電腦和電腦
你可以使用電腦的網絡瀏覽器聆聽在 Google Play 上購買的有聲書。
電子書閱讀器及其他裝置
如要在 Kobo 等電子墨水裝置上閱覽書籍,你需要下載檔案並傳輸到你的裝置。請按照說明中心的詳細指示,將檔案傳輸到支援的電子書閱讀器。


